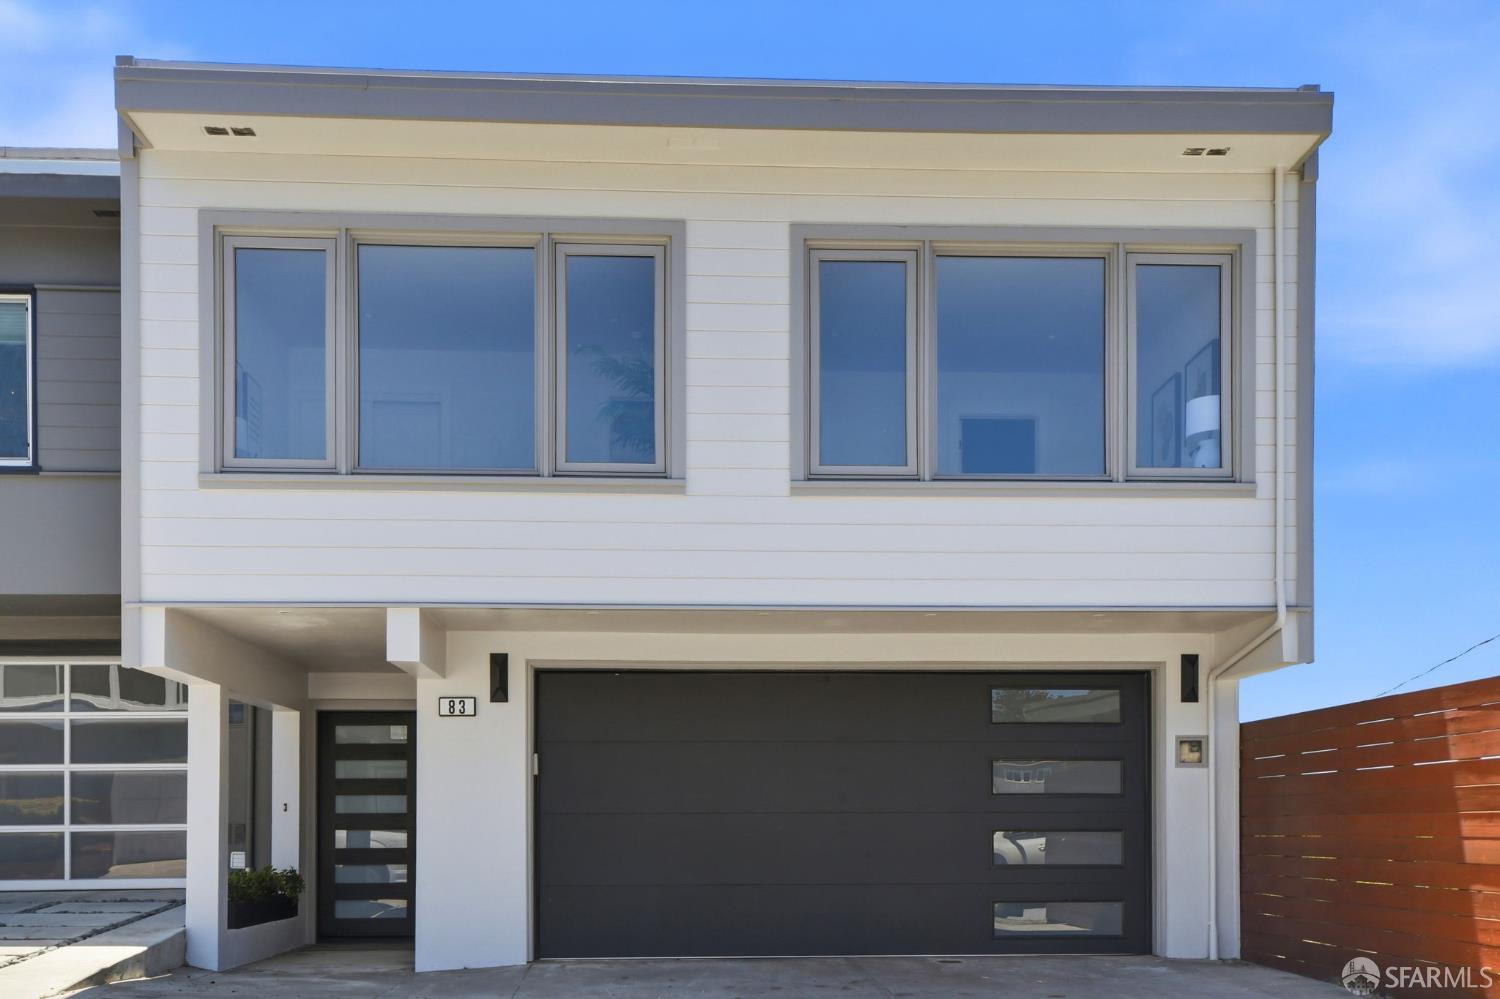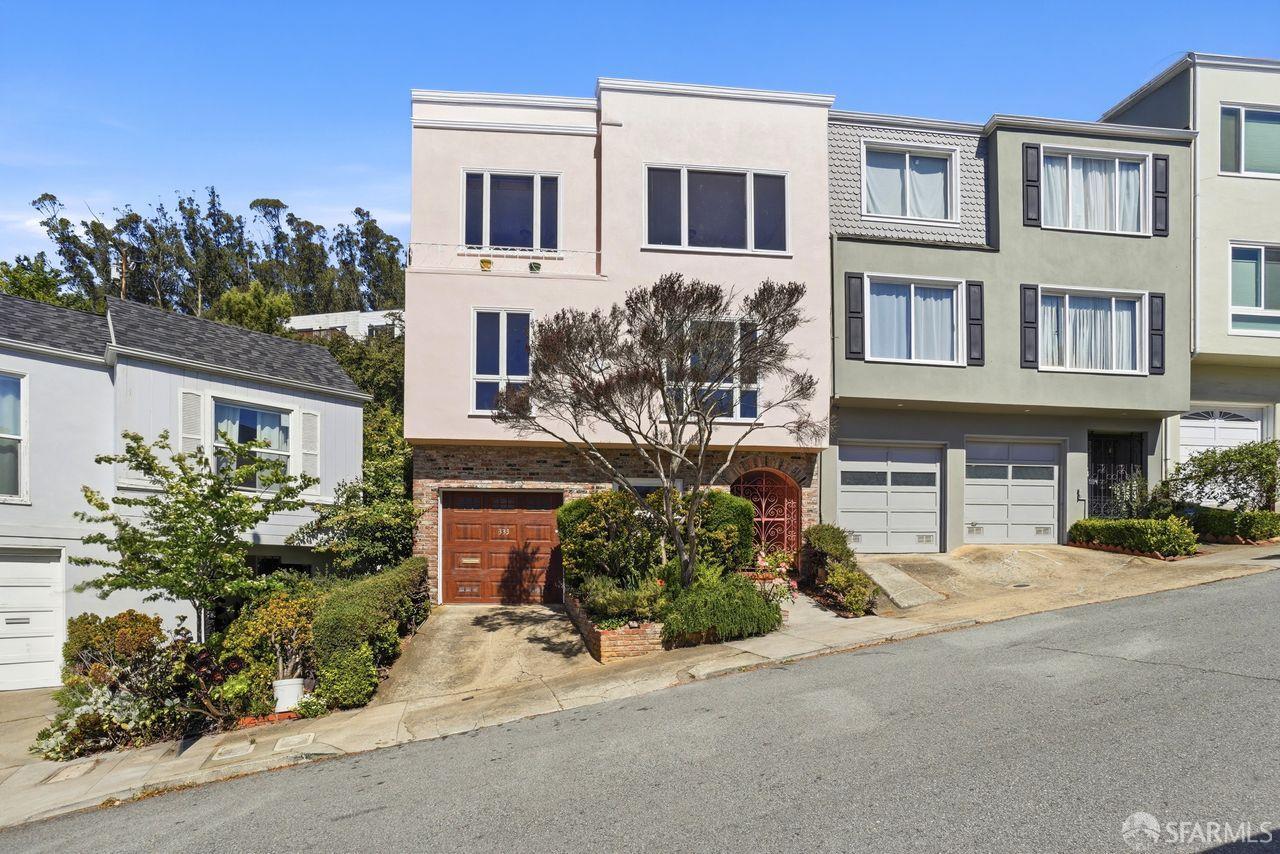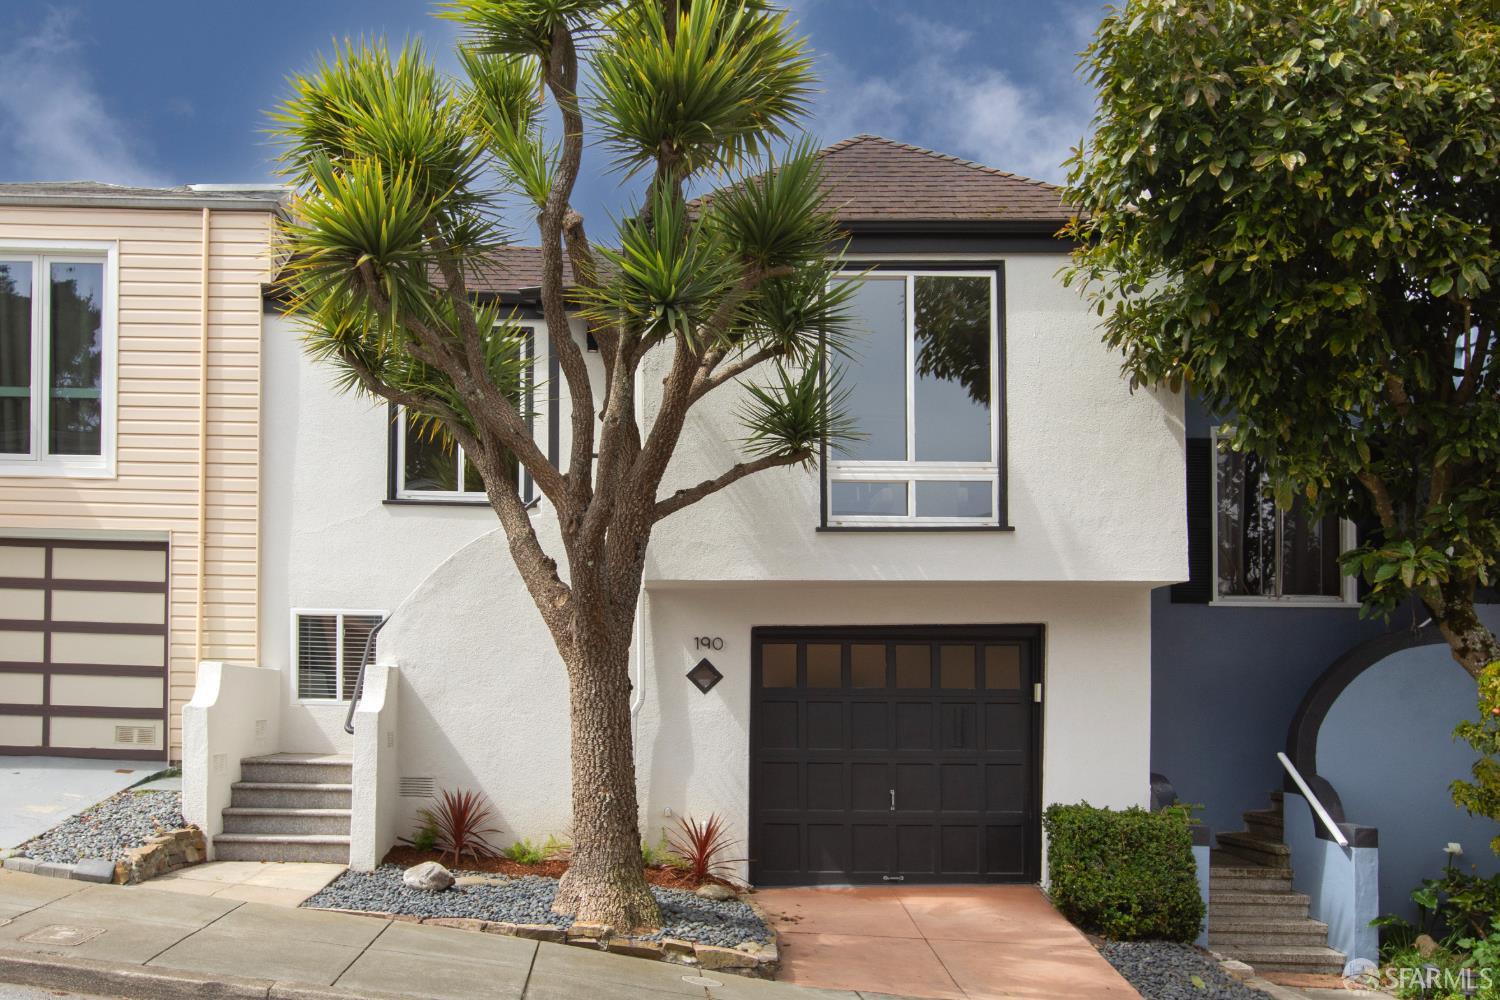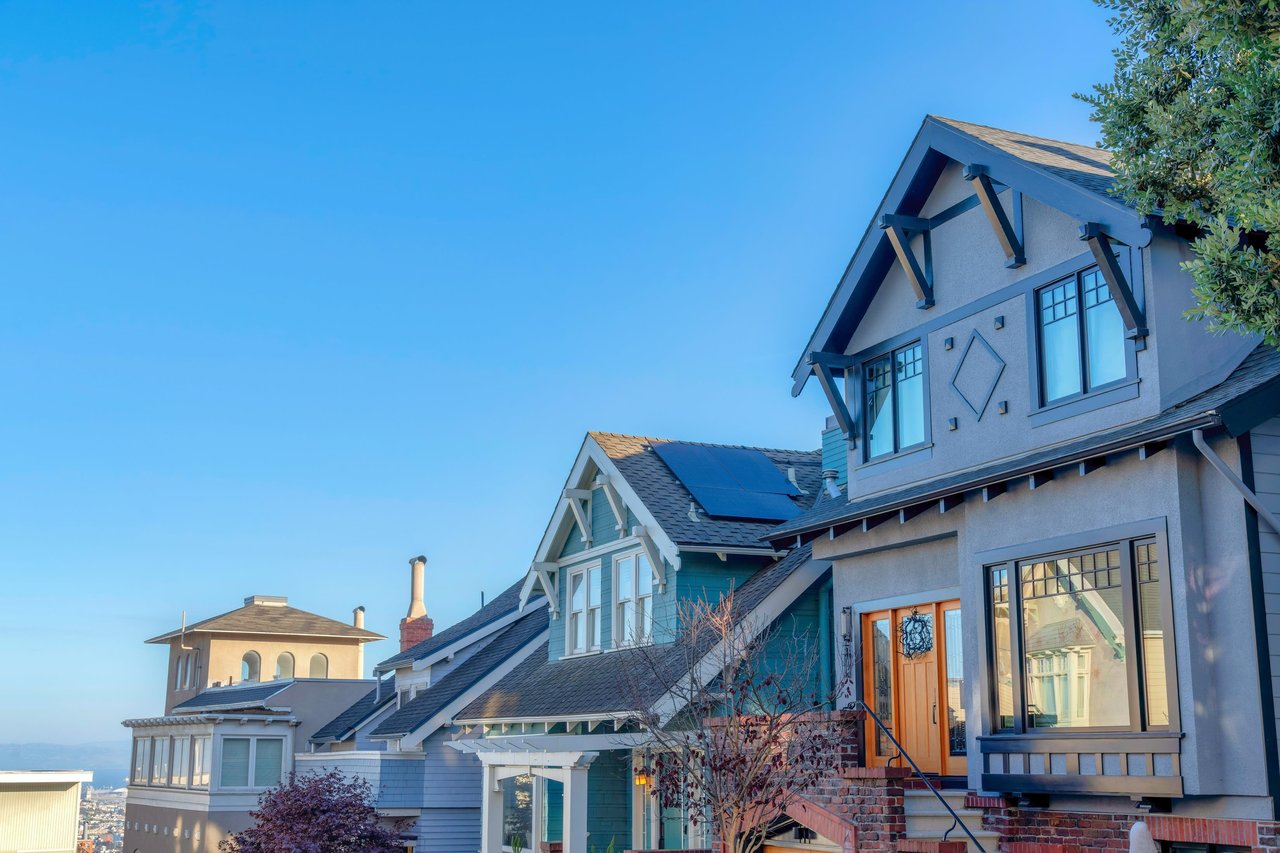
4,993 people live in Miraloma, where the median age is 47 and the average individual income is $110,398. Data provided by the U.S. Census Bureau.
Total Population
Median Age
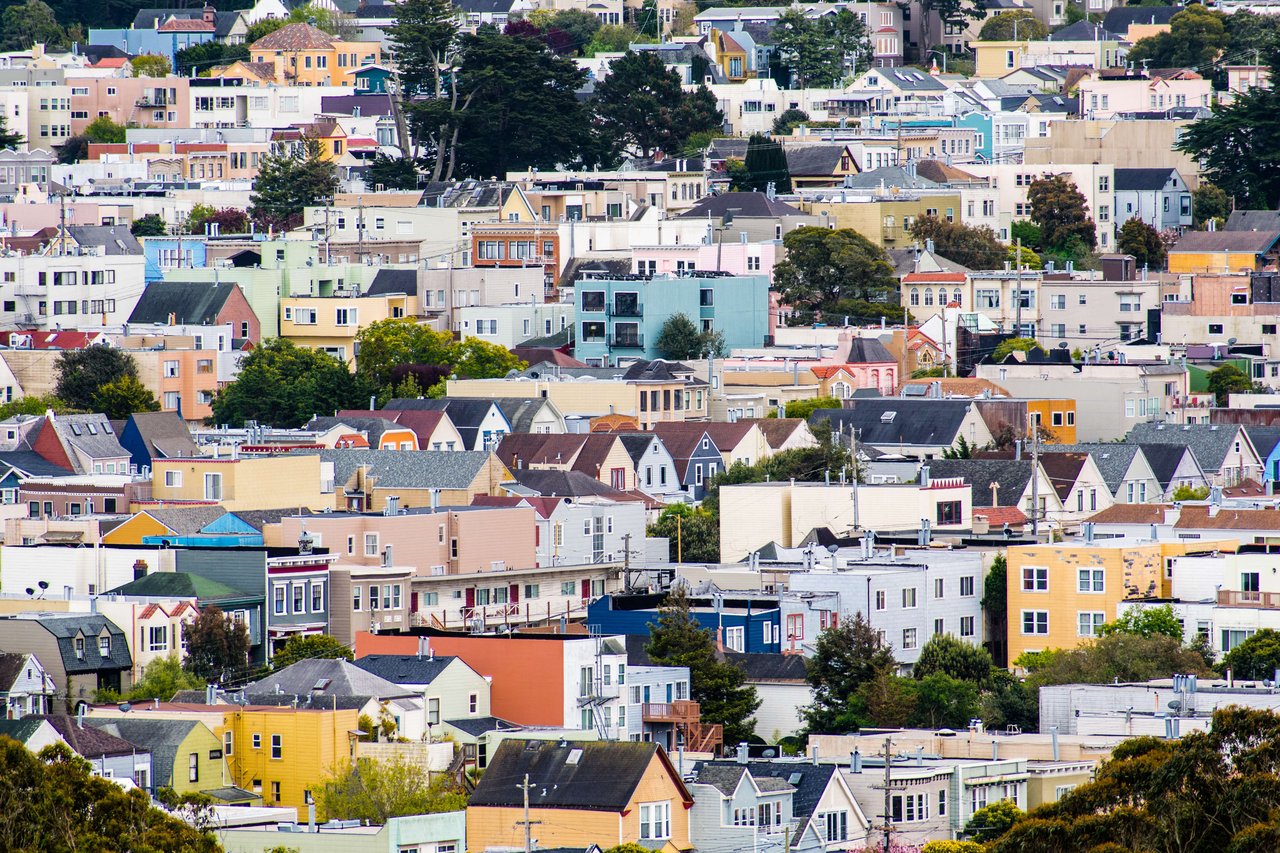
Population Density Population Density This is the number of people per square mile in a neighborhood.
Average individual Income
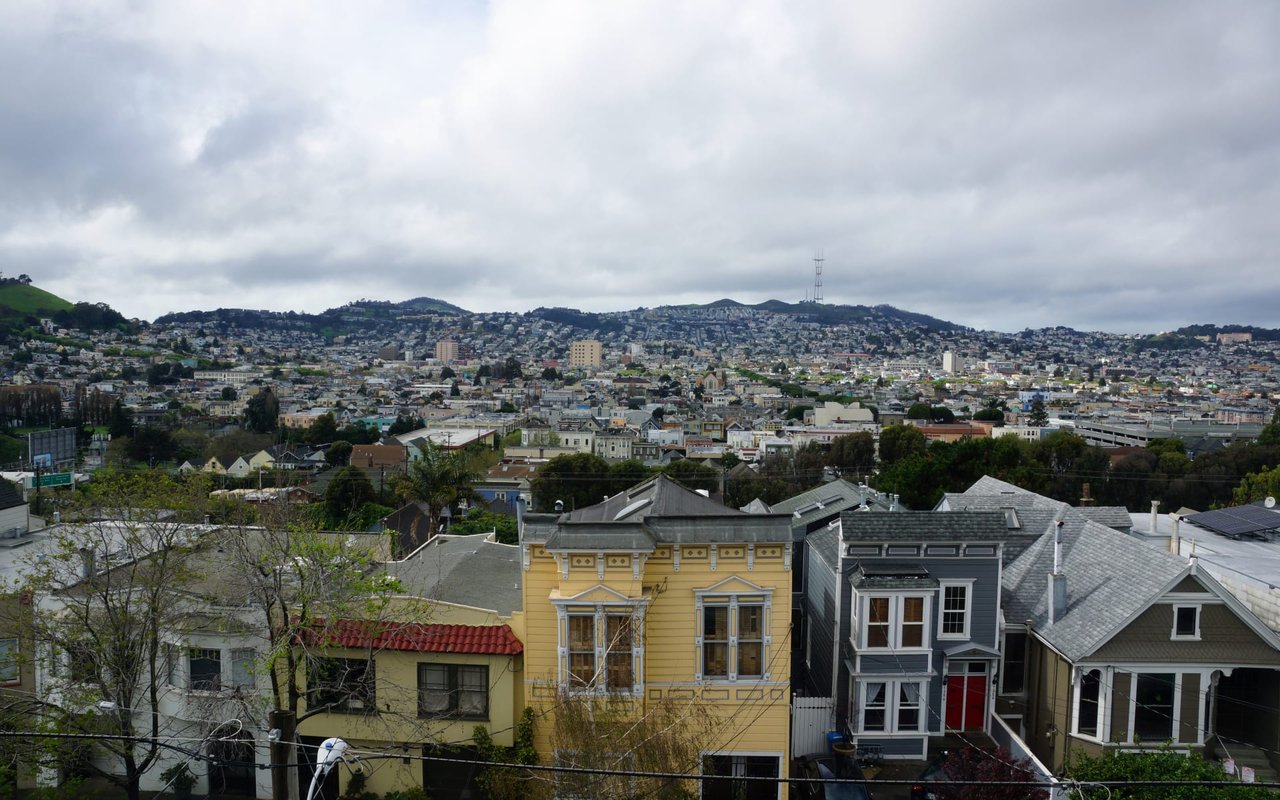
Miraloma has 2,027 households, with an average household size of 2. Data provided by the U.S. Census Bureau. Here’s what the people living in Miraloma do for work — and how long it takes them to get there. Data provided by the U.S. Census Bureau. 4,993 people call Miraloma home. The population density is 30,854 and the largest age group is Data provided by the U.S. Census Bureau.
Total Population
Population Density Population Density This is the number of people per square mile in a neighborhood.
Median Age
Men vs Women
Population by Age Group
0-9 Years
10-17 Years
18-24 Years
25-64 Years
65-74 Years
75+ Years
Education Level
Total Households
Average Household Size
Average individual Income
Households with Children
With Children:
Without Children:
Marital Status
Blue vs White Collar Workers
Blue Collar:
White Collar: